Overview
- Computational Deconvolution Analysis for exRNA Data
- Introduction
- Tutorial, Part 1: Preliminary Steps
- 1) Create a Genboree Account
- 2) Log into the Genboree Workbench
- 3) Understanding Groups
- 4) Creating a Database
- Tutorial, Part 2: Processing Raw Sequencing Data
- 1) Finding Tutorial Sequencing Data
- 2) Submitting Sequencing Data for Processing
- Tutorial, Part 3: Performing Deconvolution
- 1) Finding Your exceRpt Results and Input Data File
- 2) Creating Your Metadata Text File
- 3) Running the Deconvolution Tool
- 4) Downloading Your Deconvolution Results
- 5) Understanding Your Deconvolution Results
- Troubleshooting
- References and Attributions
Computational Deconvolution Analysis for exRNA Data
Introduction
- XDec deconvolutes small RNA-seq data from complex biofluids or fractions to estimate the exRNA expression profiles of constituent cargo profiles as well as the per-sample proportions of each constituent cargo profile.
- A full description of the deconvolution method used by XDec can be found in the Cell paper "exRNA Atlas Analysis Reveals Distinct Extracellular RNA Cargo Types and Their Carriers Present across Human Biofluids" (Murillo et al., 2019).
- We provide a number of different options for using XDec. The full list of options can be found on the Atlas.
- This page focuses on the Genboree Workbench, a web-based platform with a variety of bioinformatics tools, and contains a tutorial on how you can use the Workbench to process your own data privately.
Tutorial, Part 1: Preliminary Steps
1) Create a Genboree Account
To use our computational deconvolution tool, you will first need a Genboree account.
You can create your Genboree account by visiting the New User Registration page.
2) Log into the Genboree Workbench
After creating your Genboree account, you will need to log into the Genboree Workbench to use the tool.
You can find the Workbench by going to the Genboree homepage and clicking the Workbench button at the top of the page.
Alternatively, you can bookmark the Genboree Workbench directly.
3) Understanding Groups
After logging into your Workbench account, you'll see a screen that looks like this:

Some examples in the screenshot include:
- Examples and Test Data
- exRNA_Deconvolution_Test_User_group
- Extracellular RNA Atlas
- Each group has members who can see the contents of that group.
- Most of the groups you can see when you first log in are public groups - anyone can see the contents of these groups.
- However, you will have one private group automatically created for you - it will be named after your Genboree login name and will have "_group" added to the end.
- In my case, "exRNA_Deconvolution_Test_User_group" is my private group.
- Initially, no one else can see the contents of your group (except Genboree staff for maintenance purposes).
- However, if you want other Genboree users to have access to your group, you can manage access via your group permissions.
- You can add collaborators to your group, or they can add you to their group, so you all have access to the same data.
- You can also create a new group.
- You can create as many groups as you'd like.
4) Creating a Database
If you look inside your group, you will see that it's currently empty:

- You can create a database by using the Create Database tool.
- Don't worry about filling out the species or version - you can leave those blank.
- You should also leave Reference Sequence on its default option (User Will Upload).
- You will see a warning when you create your database, but you can just ignore it and click "Yes".
- The number of databases that you create is up to you.
- You could create a new database for each dataset you want to analyze, or a new database for each species (human, mouse), or even just stick with a single database for all of your analyses.
After clicking "Refresh" at the top of the Data Selector panel (see below), you should now be able to explore your database:

We're only interested in the Files area for this tool - you can ignore Tracks, Lists & Selections, Sample Sets, and Samples.
Tutorial, Part 2: Processing Raw Sequencing Data
1) Finding Tutorial Sequencing Data
Now that you've set up your Genboree Workbench account, the next step is to process your small RNA-seq data files through exceRpt, our small RNA-seq data processing pipeline.
After completing the tutorial, you'll want to upload your own data files to process and analyze.
For now, though, we've already uploaded a set of data files for you in the Examples and Test Data group:

The deconvolution_test_data.zip archive contains 40 FASTQ files (20 plasma and 20 urine, all healthy subjects) submitted by Alessio Naccarati's group to the exRNA Atlas.
We will drag this archive to the Input Data panel on the right side of the Workbench.
Then, we will drag the database that we created earlier to the Output Targets panel.
The output files from exceRpt will be uploaded to this database.

2) Submitting Sequencing Data for Processing
Next, we'll select exceRpt from the tool menu at the top of the Workbench:

exceRpt has many different options (see our tutorial for more information!), but we're only going to change three of them for this submission.
First, we will update the Analysis Name so that it includes some additional information about our submission.
The analysis name will be used to organize the output files from your submission.
We recommend that you always keep a timestamp of some kind in your analysis name, as it'll help you remember when you submitted each analysis.
Second, we will update 3' Adapter Sequence from "Auto-detect 3' adapter" to "MANUALLY SPECIFY 3' ADAPTER".
Then, in the Manual Input of 3' Adapter Sequence option that appears, we will put AGATCGGAAGAGCACACGTCT.
We are providing the 3' adapter sequence manually (as opposed to having exceRpt guess the sequence) because these samples have a 3' adapter sequence which is not in exceRpt's standard adapter sequence library.

Third, we will enable the Suppress Individual Sample Emails option. Normally, you will receive one email for each sample that is processed - since we are submitting 40 samples, we don't want to receive 40 emails!
This option will suppress these individual sample emails, but you will still receive a few other emails informing you about the progress of your submission.
The option can be found under the Other Advanced Options menu at the bottom of the tool dialog - you will need to expand the menu by clicking the *+*.

After changing these three settings, we'll click Submit.
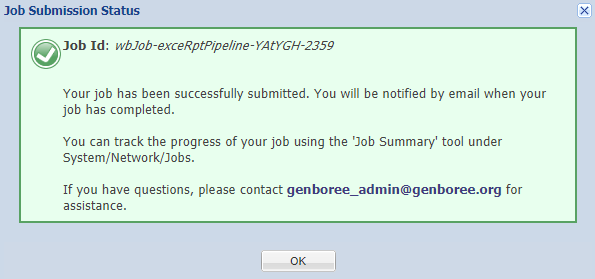
You should see a notification informing you that your samples have been submitted:
Before proceeding to part 3 of the tutorial, you'll need to wait for your samples to be processed.
Depending on how busy our cluster is, this could take several hours.
If you don't want to wait, you can access the same results via the Examples and Test Data group:

Tutorial, Part 3: Performing Deconvolution
Deconvolution requires two different input files:- An archive containing RPM-normalized read counts (created by exceRpt)
- A text file providing metadata about the samples
We'll describe how to find and/or create both files below.
1) Finding Your exceRpt Results and Input Data File
After your samples have been processed, you'll want to find the results created by exceRpt.
You'll find those results in your database organized by the analysis name you provided:

If you're interested in learning more about your results, you can read our data analysis tutorial.
However, for the deconvolution tool, we're really only interested in one file:

This archive contains RPM-normalized read counts for all of the different ncRNA species mapped by exceRpt (miRNA / piRNA / tRNA / GENCODE annotations / circular RNA).
These read counts are the input data for the deconvolution tool.
Your file will have a slightly different name than mine because your analysis name is different.
2) Creating Your Metadata Text File
The second file required by the deconvolution tool is a text file that contains metadata describing the samples.
You can find an example of this metadata text file in the Examples and Test Data group:

Upon opening the file in your word processor or Microsoft Excel, you'll notice that:
- Each row contains a sample name
- Each column contains a metadata attribute ("biofluid" and "condition", in this case).
- Each sample is labeled by biofluid ("Plasma" or "Urine") and by condition ("Healthy Control").
When you're working with your own samples, you'll create your own metadata file describing your samples and upload it to your database.
IMPORTANTLY, the sample names provided in your metadata file must match the output generated by exceRpt.
During processing, exceRpt will transform the names of your FASTQ files by inserting "sample_" at the beginning and substituting underscores ("_") for any periods, pipes ("|"), or spaces.
To verify that you are providing the correct sample names in your metadata file, you can download the _exceRpt_miRNA_ReadsPerMillion.txt file generated by exceRpt and double-check that the sample names in your metadata file match what is provided there:

For the tutorial, you can just drag our pre-made file into the Input Data panel.
Finally, make sure that you dragged your database to the Output Targets panel.
Your Workbench should now look something like this:

3) Running the Deconvolution Tool
To run the deconvolution tool, select exRNA Computational Deconvolution from the tool menu at the top of the Workbench:

This tool is much simpler than exceRpt - just provide an updated analysis name (much like you did when launching your exceRpt analysis) and click the Submit button.
The tool will likely only take a few minutes to run. Upon completion, you will receive an email informing you that your analysis is ready.
4) Downloading Your Deconvolution Results
Your deconvolution results will be uploaded to your database organized by the analysis name you provided:

You can select any of the output files (explained in more detail below) and then click the "Click to Download File" link in the Details panel to download the output file.
In particular, we recommend downloading the _deconvolutionResults archive, as it will contain all results generated by the tool.
5) Understanding Your Deconvolution Results
Output from the tool includes:
- Stage 1 Deconvolution Results
- Stage 1_Results_Boxplots.pdf - Boxplots of the per-sample proportions for each estimated constituent cargo profile (rows) numbered 1 through k. Boxplots are separated based on metadata columns (e.g., disease, biofluid, etc.).
- Stage1_Results_Expression.txt - exRNA expression in transformed transcript abundance values (rows) for each estimated constituent cargo profile (columns) numbered 1 through k (profiles modeled for the input dataset).
- Stage1_Results_Heatmap_Correlations.pdf - Estimated constituent cargo profiles (rows) are correlated using the exRNA expression in transformed transcript abundance values across the informative RNAs (see Murillo et al., 2019) against the 6 CTs (columns) previously identified through the deconvolution of the exRNA Atlas (see Murillo et al., 2019).
- Stage1_Results_Heatmap_Proportions.pdf - Heatmap of the per-sample proportions (columns) for each estimated constituent cargo profile (rows) numbered 1 through k. Dendrogram is included to cluster similar composed samples.
- Stage1_Results_Proportions.txt - Per-sample proportions (columns) for each estimated constituent cargo profile (rows) numbered 1 through k (profiles modeled for the input dataset).
- Stage 2 Deconvolution Results
- NOTE: Stage 2 deconvolution is performed for each metadata value that is associated with at least 20 samples.
- Stage2_[METADATA COLUMN]_[METADATA VALUE]_miRNA_RPM.txt - Tables of estimated average cargo profiles across miRNA transcripts in reads per million (rows) separated based on provided metadata values. Columns include mean expression and std. errors for each estimated constituent cargo profile (numbered 1 through k) as well as degrees of freedom, explained variances, and per sample residuals.
You can ignore the jobFile.json file. This file just contains various internal settings used to process your submission.
Troubleshooting
- Make sure that the row headers in the sample descriptor file match the sample names generated by exceRpt.
- The sample names generated by exceRpt are based on the file names of the inputs used for exceRpt.
- Remember that you can see the relevant list of sample names by viewing the exceRpt_miRNA_ReadsPerMillion.txt file (located in the postProcessedResults_v4.6.3 directory).
- Make sure that your submission contains data from at least 40 samples. Submissions with lower numbers of samples will fail processing (as the tool's underlying algorithm requires at least 40 samples to work properly).
- For Stage 2, metadata values must be associated with at least 20 samples in order to be processed. Any metadata values associated with fewer than 20 samples will be skipped during this stage of the tool.
References and Attributions
- Onuchic, V., Hartmaier, R.J., Boone, D.N., Samuels, M.L., Patel, R.Y., White, W.M., Garovic, V.D., Oesterreich, S., Roth, M.E., Lee, A.V., et al. (2016). Epigenomic Deconvolution of Breast Tumors Reveals Metabolic Coupling between Constituent Cell Types. Cell Reports 17, 2075–2086.
- Tool designed and implemented by Oscar D. Murillo at the Bioinformatics Research Lab, Baylor College of Medicine, Houston, TX.
- Integrated into the Genboree Workbench by William Thistlethwaite at the Bioinformatics Research Lab, Baylor College of Medicine, Houston, TX.