Overview
- Long RNA-Seq Data Analysis Using RSEQtools in the Genboree Workbench
- Preliminary Steps to Set Up Any Analysis in the Genboree Workbench
- Step-by-step Instructions to Set Up Long RNA-Seq Data Analysis
- Example Data for Running RSEQtools
- RSEQTools Pipeline - Workflow Implemented in the Genboree Workbench
- RSEQtools Modules used in Genboree Implementation
- References and Attributions
Long RNA-Seq Data Analysis Using RSEQtools in the Genboree Workbench
 View Screencast (no audio)
Preliminary Steps to Set Up Any Analysis in the Genboree Workbench
- Create a Group for your analysis -
 FAQ. This step is optional. You can also use your default/existing group.
What is a  Group?
 A "Group" contains Databases and Projects and controls access to all content within.
You control access to your Group(s), and who is a member of your group. You can also belong to multiple Groups (i.e. collaborators).
- Create a Database for your analysis - FAQ. This step is optional. You can also use your default/existing database.
What is a  Database?
 A Database contains Tracks, Lists, Sample Sets, Samples, and Files.
Each database can be associated with a reference genome.
- Create a Redmine Project for your analysis - FAQ. This step is REQUIRED.
What is a  Redmine Project?
 The Redmine Project holds files (HTML, plots, etc) that contain analysis results from your tool.
- Upload your data file(s) - FAQ
What type of files can be uploaded? The long RNA-Seq pipeline using RSEQtools accepts a single-end or paired-end FASTQ files as input.
The input files can be compressed.
Step-by-step Instructions to Set Up Long RNA-Seq Data Analysis
- Drag Single or paired-end FASTQ files to
Input Datapanel. The input files can be compressed. - Drag a
Databaseand aProjecttoOutput Targetspanel to store results. - Select
Transcriptome»Analyze RNA-Seq Data»Analyze RNA-Seq data by RSEQtoolsfrom the Toolset menu. - Fill in appropriate details in the Tool Settings dialog box
- Submit your job. Upon completion of your job, you will receive an email.
- Download the results of your analysis from your
Database. The results data will end up under the RSEQtools folder in theFilesarea of your output database.
Within that folder, yourAnalysis Namewill be used as a sub-folder to hold the files generated by that run of the tool.- Click on your results file(s) in the
Data Selectorpanel. - Select the link
Click to Download Filefrom theDetailspanel to download your results file(s).
- Click on your results file(s) in the
- View plots from the
Projectspage.- Click on your project name in the
Data Selectorpanel. - Click on
Link to Projectin the Details panel to view yourProjectspage.
- Click on your project name in the
- If you would like to visualize your signal tracks in the UCSC Genome Browser, follow these steps:
- Drag your
DatabasetoOutput Targetspanel. - Select
Data»Databases»Unlock/Lock Databasefrom the Toolset menu. - Click Submit in the Setting Dialog box to unlock your database.
- Clean
Output Targetspanel. - Drag your
DatabasetoInput Datapanel. - Select
Visualization»UCSC Genome Browserfrom the Toolset menu. - Select the signal tracks with bigwig files (already made by the pipeline).
- Click Submit in the Setting Dialog box to create the link to visualize the selected tracks in the UCSC Genome Browser.
- Click Launch UCSC Genome Browser link in the dialog box.
- Drag your
Example Data for Running RSEQtools
A sample from a deep-sequencing study to analyze the transcriptome changes that occur during the
differentiation of human embryonic stem cells into the neural lineage has been used in this example.
The sample consists of 27 nucleotide single-end reads, that are aligned to human reference genome build hg18
and to a splice junction library generated from the UCSC Known Genes annotation set using Bowtie2.
The mapped reads are then analyzed using various modules in RSEQtools.
Sample datasets with input and output files can be found here:
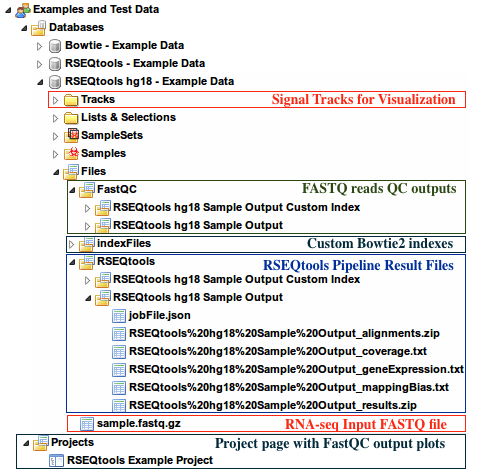
- Under the group
Examples and Test Data, select the databaseRSEQtools hg18 - Example Data - Input FASTQ file can be found under:
Files » sample.fastq.gz - Outputs of RSEQtools pipeline can be found under
Files » RSEQtoolsfolder of this database - QC Plots from FastQC can be found in the
Projectspage - Custom Bowtie2 indexes can be found under
Files » indexFiles » bowtie » [Your custom index folder] - Signal tracks are uploaded under the
Trackssection of this database.
RSEQTools Pipeline - Workflow Implemented in the Genboree Workbench
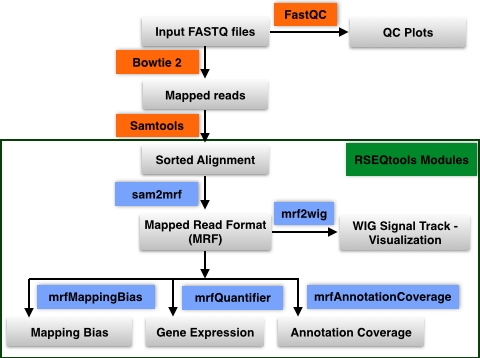
- Input Sequence import: User uploads single or paired-end FASTQ input sequence files to their database in the workbench
- QC FastQ reads: Input FastQ sequence reads are checked for quality using FastQC
- Map reads to reference genome: Sequence reads are mapped to reference genome using Bowtie 2
- Sort alignments: Alignments in SAM format are sorted using Samtools
- Convert to Mapped Read Format (MRF): Sorted Alignments in SAM format are converted to MRF using RSEQtools
- Downstream analysis using modules in RSEQtools
- Gene expression values: Calculate gene expression values using module mrfQuantifier
- Annotation Coverage: Calculate annotation coverage value using module mrfAnnotationCoverage
- Mapping Bias: Calculate mapping bias for a given annotation set using module mrfMappingBias
- Signal Tracks: Generate signal tracks in WIG format using module mrf2wig
RSEQtools Modules used in Genboree Implementation
This module calculates expression values (RPKM; read coverage normalized per million mapped nucleotides
and the length of the annotation model per kb). Given a set of mapped reads in MRF and an annotation set
(representing exons, transcripts, or gene models) mrfQuantifier calculates an expression value for each annotation entry.
This is done by counting all the nucleotides from the reads that overlap with a given annotation entry.
Subsequently, this value is normalized per million mapped nucleotides and the length of the annotation item per kb.
Module to calculate mapping bias for a given annotation set. Aggregates mapped reads that overlap with
transcripts (specified in file.annotation) and outputs the counts over a standardized transcript
(divided into 100 equally sized bins) where 0 represents the 5' end of the transcript and
1 denotes the 3' end of the transcripts. This analysis is done in a strand specific way.
Module to calculate annotation coverage. Sample a set of mapped reads and determine the
fraction of transcripts (specified in annotation file) that have at least -times uniform coverage.
Generates signal track (WIG) of mapped reads from a MRF file. By default, the values in the
WIG file are normalized by the total number of mapped reads per million.
Only positions with non-zero values are reported.
References and Attributions
- Lukas Habegger, Andrea Sboner, Tara A. Gianoulis, Joel Rozowsky, Ashish Agarwal, Michael Snyder, Mark Gerstein.
RSEQtools: A modular framework to analyze RNA-Seq data using compact, anonymized data summaries.
Bioinformatics. 2010 Dec 5; 27(2) : 281-283 [PubMed] - Langmead B, Salzberg SL. Fast gapped-read alignment with Bowtie 2. Nature Methods.
2012 Mar 4; 9 : 357-359. [PubMed] - Li H., Handsaker B., Wysoker A., Fennell T., Ruan J., Homer N., Marth G., Abecasis G., Durbin R. and
1000 Genome Project Data Processing Subgroup. The Sequence alignment/map (SAM) format and SAMtools.
Bioinformatics. 2009 25: 2078-9. [Pubmed] - RSEQtools was developed by the Gerstein Lab
at Yale University - Integrated into the Genboree Workbench
by Sai Lakshmi Subramanian
at the Bioinformatics Research Laboratory, Baylor College of Medicine, Houston, TX.