How do I prepare, upload, and evaluate 27k / 450k data? (Multi-column (i.e. matrix) data format)
Introduction
27k and 450k References
In order to grasp the general procedure of understanding and utilizing the 27k and 450k output we recommend some of the following manuscripts:- 27k
- DNA methylation profiling reveals a predominant immune component in breast cancers
- 450k
- Validation of a DNA methylation microarray for 450,000 CpG sites in the human genome
- Evaluation of the Infinium Methylation 450K technology
Tutorial Data Set
In order to illustrate how to use the Genboree Workbench to evaluate 27k / 450k data, we're going to demonstrate how to utilize a publicly available data set:- Validation of a DNA methylation microarray for 450,000 CpG sites in the human genome
- http://www.ncbi.nlm.nih.gov/geo/query/acc.cgi?acc=GSE29290
- Download and decompress this file:
- http://www.ncbi.nlm.nih.gov/geosuppl/?acc=GSE29290&file=GSE29290%5FMatrix%5FProcessed%2Etxt%2Egz
- GSE29290_Matrix_Processed.txt.gz
- GSE29290_Matrix_Processed.txt.zip
- GSE29290_Matrix_Processed.txt.gz
- http://www.ncbi.nlm.nih.gov/geosuppl/?acc=GSE29290&file=GSE29290%5FMatrix%5FProcessed%2Etxt%2Egz
- Download and decompress this file:
- The data is tab delimited
- One column has to represent the probe ID
- I.e. cg00000029
- One column has to represent the probe score for each sample (i.e. <sample>.AVG_Beta, <sample>.M-value, etc.)
ID_REF    Sample_1.AVG_Beta    Sample_1.Detection Pval    Sample_2.AVG_Beta    Sample_2.Detection Pval    Sample_3.AVG_Beta    Sample_3.Detection Pval
cg00000029    0.8296142    0    0.852155     0    0.8956234    0   ...
cg00000108    0.8492596    0    0.8898684    0    0.9276204    0   ...
cg00000109    0.8247395    0    0.8609225    0    0.8725377    0   ...
cg00000165    0.8228635    0    0.8665444    0    0.8800115    0   ...
...              ...      ...     ...      ...        ...     ...  ...
Preparing Processed Matrix for Genboree Workbench
We need to take the processed matrix and prepare it for import within the 'Array Data Importer' utility. Please read the help on this tool, but we will also post the necessary file format here:
Format:
#probe<tab><sample1_name><tab><sample2_name><tab><sample3_name>
<ProbeID_1><tab><ProbeScore_1-sample1><tab><ProbeScore_1-sample2><tab><ProbeScore_1-sample3>
<ProbeID_2><tab><ProbeScore_2-sample1><tab><ProbeScore_2-sample2><tab><ProbeScore_2-sample3>
<ProbeID_3><tab><ProbeScore_3-sample1><tab><ProbeScore_3-sample2><tab><ProbeScore_3-sample3>
...
Actual implementation of above sample (in multi-column matrix data format):
| ID_REF | Sample_1.AVG_Beta | Sample_2.AVG_Beta | Sample_3.AVG_Beta |
| cg00000029 | 0.8296142 | 0.852155 | 0.8956234 |
| cg00000108 | 0.8492596 | 0.8898684 | 0.9276204 |
| cg00000109 | 0.8247395 | 0.8609225 | 0.8725377 |
| cg00000165 | 0.8228635 | 0.8665444 | 0.8800115 |
- A single score column for each sample
- All other columns must be removed prior to uploading and importing
- A unique sample name (which will be used to name the track)
- Probe IDs that exist within the ROI (region of interest) annotation track
- Probe IDs that do not exist within the 27K / 450K ROI track will be ignored
- Numerical values for the Score data
- Tab delimited
- GSE29290_Matrix_Processed-AVG_Beta.tsv.zip
Preparing Metadata for 27k & 450k Data Sets
In order to be able to utilize the Genboree Workbench to analyze your array data, it is most convenient if you produce some metadata for your samples. Providing metadata for your samples will allow you to more easily create sets of tracks (called Track Entity Lists) in order to be able to evaluate your samples in a variety of groups.
Creating Track Metadata- This example has 2 metadata columns
- cell_type
- Colorectal_cancer
- Colorectal_cancer_knock_out
- Breast_normal
- Breast_tumor
- experiment_type
- 450k
- cell_type
| #name | cell_type | experiment_type |
| Sample_1.AVG_Beta:450K | Colorectal_cancer | 450k |
| Sample_2.AVG_Beta:450K | Colorectal_cancer | 450k |
| Sample_3.AVG_Beta:450K | Colorectal_cancer | 450k |
| Sample_4.AVG_Beta:450K | Colorectal_cancer_knock_out | 450k |
| Sample_5.AVG_Beta:450K | Colorectal_cancer_knock_out | 450k |
| Sample_6.AVG_Beta:450K | Colorectal_cancer_knock_out | 450k |
| Sample_7.AVG_Beta:450K | Breast_normal | 450k |
| Sample_8.AVG_Beta:450K | Breast_normal | 450k |
| Sample_9.AVG_Beta:450K | Breast_normal | 450k |
| Sample_10.AVG_Beta:450K | Breast_normal | 450k |
| Sample_11.AVG_Beta:450K | Breast_normal | 450k |
| Sample_12.AVG_Beta:450K | Breast_normal | 450k |
| Sample_13.AVG_Beta:450K | Breast_normal | 450k |
| Sample_14.AVG_Beta:450K | Breast_normal | 450k |
| Sample_15.AVG_Beta:450K | Breast_tumor | 450k |
| Sample_16.AVG_Beta:450K | Breast_tumor | 450k |
| Sample_17.AVG_Beta:450K | Breast_tumor | 450k |
| Sample_18.AVG_Beta:450K | Breast_tumor | 450k |
| Sample_19.AVG_Beta:450K | Breast_tumor | 450k |
| Sample_20.AVG_Beta:450K | Breast_tumor | 450k |
| Sample_21.AVG_Beta:450K | Breast_tumor | 450k |
| Sample_22.AVG_Beta:450K | Breast_tumor | 450k |
- GSE29290_full_track_metadata-matrix-format.tsv
Using the Genboree Workbench to Evaluate 27k & 450k Data Sets - Step by Step
- Create a new Database
- Drag your group into the 'Output Targets' window
- Click 'Data' -> 'Databases' -> 'Create Database'
- Select 'Template: Human (hg19)
- Enter a Database Name
- Click Submit
- Create a new Project
- Drag your group into the 'Output Targets' window
- Click 'Data' -> 'Projects' -> 'Create Project'
- Enter Project Name
- Click Submit
- Upload your prepared array data ('GSE29290_Matrix_Processed-AVG_Beta.tsv.zip')
- Remove your Group from the 'Output Targets' window
- Drag your Database into the 'Output Targets' window
- Click 'Data' -> 'Files' -> 'Transfer File'
- Choose your file
- Click Submit
- Import your array data
- Drag your Database into the 'Output Targets' window
- Drag your file ('GSE29290_Matrix_Processed-AVG_Beta.tsv.zip') into the 'Input Data' window
- This file is located in your_group -> Databases -> your_database -> Files
- Click 'Data' -> 'Tracks' -> 'Import' -> 'Array Data'
- Select 'Hs Methylation:450k'
- You would select 'Hs Methylation:27k' if you are using 27k data
- Select File Format 'Muti-column' (default)
- Click Submit
- Wait for success email
Hello Kevin Riehle,

Your Array Data Importer job has completed successfully.

JOB SUMMARY:
  JobID          : wbJob-arraydataimporter-1347059333_775361

The following array/probe file has been imported:
 GSE29290_Matrix_Processed.txt-array_format-450k.tsv

The following tracks were uploaded in the target database:

Sample_19.AVG_Beta:450k_avg_beta
Sample_2.AVG_Beta:450k_avg_beta
Sample_1.AVG_Beta:450k_avg_beta
Sample_3.AVG_Beta:450k_avg_beta
Sample_15.AVG_Beta:450k_avg_beta
Sample_17.AVG_Beta:450k_avg_beta
Sample_16.AVG_Beta:450k_avg_beta
Sample_14.AVG_Beta:450k_avg_beta
Sample_12.AVG_Beta:450k_avg_beta
Sample_8.AVG_Beta:450k_avg_beta
Sample_9.AVG_Beta:450k_avg_beta
Sample_7.AVG_Beta:450k_avg_beta
Sample_13.AVG_Beta:450k_avg_beta
Sample_21.AVG_Beta:450k_avg_beta
Sample_22.AVG_Beta:450k_avg_beta
Sample_5.AVG_Beta:450k_avg_beta
Sample_11.AVG_Beta:450k_avg_beta
Sample_6.AVG_Beta:450k_avg_beta
Sample_10.AVG_Beta:450k_avg_beta
Sample_4.AVG_Beta:450k_avg_beta
Sample_18.AVG_Beta:450k_avg_beta
Sample_20.AVG_Beta:450k_avg_beta

The Genboree Team
...
Add Track Metadata
- Upload track metadata file
- GSE29290_full_track_metadata-matrix-format.tsv
- Drag your File (i.e. 'GSE29290_full_track_metadata-matrix-format.tsv') to 'Input Data' window
- Drag your Database to 'Output Targets' window
- Click 'Data' -> 'Tracks' -> 'Import' -> 'Track Metadata'
- Uncheck 'Create New Tracks?'
- Click Submit
- Drag your Database into 'Input Data'
- Click 'Visualization' -> 'View Track Grid'
- X-axis attribute
- cell_type
- Y-axis attribute
- experiment_type
- Click Submit
- Click the blue hyperlink 'Launch Grid Viewer'
- X-axis attribute
- Select the (8) Breast_normal cell, the (8) Breast_tumor cell, the (3) Colorectal_cancer cell, and the (3) Colorectal_cancer_knock_out cell.
- Click 'Selections' -> 'Save Selections'
- Select your Group
- Select your Database
- Type in a name (i.e. 'all22samplesTrackEntityList')
- Click 'Save Selections'
- Select the (8) Breast_normal cell
- Click 'Selections' -> 'Save Selections'
- Select your Group
- Select your Database
- Type in a name (i.e. 'Breast_normal_450k')
- Click 'Save Selections'
- Select the (8) Breast_tumor cell (and deselect the (8) Breast_normal_cell cell if it is still highlighted)
- Click 'Selections' -> 'Save Selections'
- Select your Group
- Select your Database
- Type in a name (i.e. 'Breast_tumor_450k')
- Click 'Save Selections'
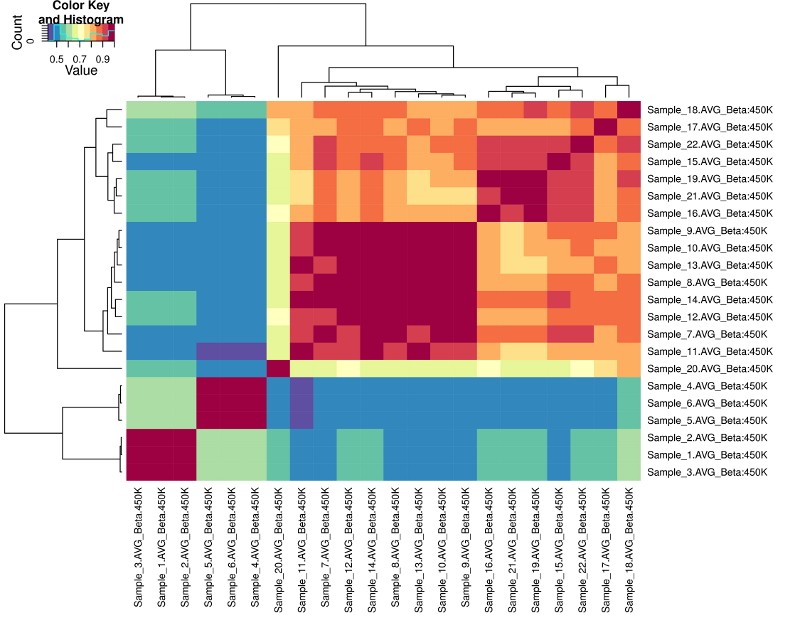
Heatmap
- Run Heatmap on All Tracks
- (Clear any entries in the 'Input Data' window if they exist)
- Drag your track entity list(s) into the 'Input Data' window (i.e. 22samplesTrackEntityList)
- These track entity lists are located in your_group -> Databases -> your_database -> Lists & Selections -> List of Tracks
- Drag your desired ROI (regions of interest) track into the 'Input Data' window
- For example, you can use the Promoters:LCP ROI track
- This track is located in ROI Repository -> Databases -> ROI Repository - hg19 -> Tracks -> Class: Regulation
- For example, you can use the Promoters:LCP ROI track
- Drag your Database into the 'Output Targets' window
- Drag your Project into the 'Output Targets' window
- Click 'Epigenome' -> 'Compute Similarity Matrix (heatmap)'
- Click Submit
- Wait for a confirmation email
  Hello Kevin Riehle,

  Your  job completed successfully.

  Job Summary:
    JobID          - wbJob-epigenomicsHeatmap-pCvyYR-4758
    Analysis Name  - all22_self_tutorial-EpigenomeExpHeatmap2013-02-27-11:07:03
  Inputs:
    1. Entitylist       - all22samplesTrackEntityList
    2. Trk              - Promoters%3ALCP
    3. Entitylist       - all22samplesTrackEntityList
  Outputs:
    1. Db               - 450k_tutorial_matrix
    2. Prj              - 450k_tutorial_matrix_project
  Settings:
    analysisName        - all22_self_tutorial-EpigenomeExpHeatmap2013-02-27-11:07:03
    color               - Spectral
    dendograms          - both
    density             - histogram
    distfun             - dist
    hclustfun           - hclust
    height              - 8
    key                 - TRUE
    keySize             - 0.75
    normalization       - quant
    quantileNormalized  - false
    removeNoDataRegions - true
    spanAggFunction     - avg
    trace               - none
    width               - 10

- The Genboree Team

Result File Location in the Genboree Workbench:
  http://genboree.org/java-bin/project.jsp?projectName=450k_tutorial_matrix_project
- You will see that we witness clustering among:
- 8 Breast_normal
- 7 Breast_tumor (Sample_20 is an outlier)
- 3 Colorectal_cancer
- 3 Colorectal_cancer_knock_out
LIMMA
Run LIMMA- Drag your first track entity list into the 'Input Data' window (i.e. 'Breast_normal_450k')
- Drag your second track entity list into the 'Input Data' window (i.e. 'Breast_tumor_450k')
- Drag your ROI (regions of interest) track into the 'Input Data' window (i.e. 'Promoters:ALL)
- This track is located in ROI Repository -> Databases -> ROI Repository - hg19 -> Tracks -> Class: Regulation
- Drag your Database into the 'Output Targets' window
- Drag your Project into the 'Output Targets' window
- Click 'Epigenome' -> 'Analyze Signals' -> 'Compare by LIMMA' -> 'Tracks'
- Click Submit
- Wait for confirmation emails:
- "Genboree: Your Epigenomic Experiment Sets Comparison Using Limma job is complete"
- "LFF API Upload [SUCCESS]"
SPARK
Run SPARK- Drag your first track entity list into the 'Input Data' window (i.e. 'Breast_normal_450k')
- Drag your second track entity list into the 'Input Data' window (i.e. 'Breast_tumor_450k')
- Drag your ROI (regions of interest) track into the 'Input Data' window (i.e. 'Promoters:ALL)
- This track is located in ROI Repository -> Databases -> ROI Repository - hg19 -> Tracks -> Class: Regulation
- Drag your Database into the 'Output Targets' window
- Click 'Epigenome' -> 'Analyze Signals' -> 'Cluster by Spark'
- Select your ROI Track
- Single click on your ROI track (i.e. Promoters:LCP)
- Customize the settings or leave the defaults
- Optionally change track colors
- I.e. change samples 15-22 to 'green' for Data Track Colors
- Click Submit
- Wait for confirmation email and follow directions
- Select your ROI Track
Also available in: PDF